Triple Top Patterns: Strategies for Successful Trading
In the intricate world of financial markets, traders are constantly seeking tools and strategies to navigate the complex terrain of price movements. One such pattern that has caught the attention of seasoned traders is the “Triple Top Pattern.” In this comprehensive guide, we will delve into the intricacies of this pattern, exploring its definition, identification, and strategies for successful trading.
Understanding the Triple Top Pattern

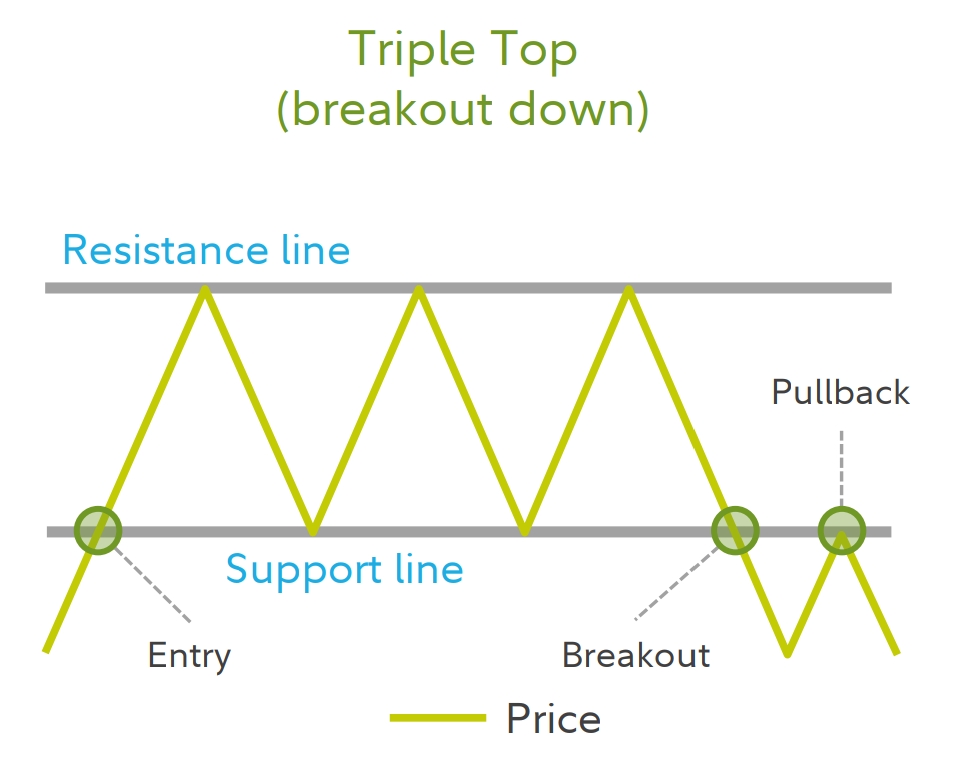
The triple top pattern is a technical analysis chart pattern that signals a potential reversal of an uptrend. It typically occurs after an extended price increase and consists of three peaks at nearly the same price level, separated by troughs. The pattern is complete when the price breaks below the support level, indicating a shift from bullish to bearish sentiment.
Identifying the Triple Top Pattern
- 1. Three Peaks: The first step in recognizing a triple top is identifying three distinct peaks on the price chart. These peaks should be relatively equal in height and form a horizontal line.
- 2. Troughs: Connect the troughs between the peaks to create a support level. The support level should be relatively flat, indicating that buyers are struggling to push the price higher.
- 3. Confirmation Break: The pattern is confirmed when the price breaks below the established support level. This breach signifies a shift in market sentiment from bullish to bearish.
Trading Strategies for the Triple Top Pattern

- 1. Entry Points: Traders often wait for the confirmation break before entering a short position. This involves selling assets as the price breaks below the support level.
- 2. Stop-Loss and Take-Profit: Implementing a stop-loss just above the support level can help manage risks. Take-profit levels can be set based on the distance between the peaks and troughs, providing a clear risk-reward ratio.
- 3.Volume Analysis: Confirming the pattern with volume analysis adds another layer of validation. A breakout with increased volume strengthens the reliability of the triple top pattern.
Real-World Example
Let’s take a hypothetical example to illustrate the application of the triple top pattern. Suppose a stock has experienced a prolonged uptrend, reaching three peaks around $100. The troughs connect at a support level of $95. When the price breaks below $95 with increased volume, traders might interpret this as a signal to enter a short position, anticipating a bearish trend reversal.
Cautionary Notes
While the triple top pattern can be a powerful tool in a trader’s arsenal, it is essential to exercise caution. Not all patterns result in a reversal, and false signals can occur. Traders should consider using additional indicators and conducting thorough market analysis to enhance the probability of successful trades.
Conclusion
In conclusion, mastering the triple top pattern requires a combination of technical analysis skills, patience, and risk management. By understanding the pattern’s definition, identification process, and implementing effective trading strategies, traders can leverage this tool to make informed decisions in the dynamic world of financial markets. However, it is crucial to approach trading with a cautious mindset, recognizing the inherent risks and uncertainties that come with the pursuit of market profits.
Check out More pattern:
- 01.Understanding the Double Bottom Pattern
- Understanding the Double Top Pattern in Technical Analysis
- 01 Mastering the Head and Shoulders Chart Pattern
- Triple Bottom Patterns: Strategies for Successful Trading
- “Cracking the Code: Price Action Patterns for Smart Trading”
- Paper Trading TradingView
- Neostox Paper Trading
